A recent post describing a
graph of the history of philosophy provides the perfect illustration of the data visualization
I was proposing for the weavr. It also suggests an implementation of the unique dataset the weavr provides. That is, if there was a place in the weavr dashboard or a prosthetic that revealed a simple relationship pairing (e.g., mystery_weavr fear; fear graveyard, etc.), one could upload this into
gelphi and immediately have access to a visual representation of the data.
One way I would create this prosthetic is to simply reverse engineer the
weavr configuration in such a way that the current content becomes related to the weavr in question. Thus, the home address, emotions, keywords, blog, and any other content would get paired with the weaver.
Example:
mystery_weavr 14985 Roglynn Rd, Red Bluff, CA 96080, USA
mystery_weavr bad
mystery_weavr good
mystery_weavr happy
mystery_weavr 38.32506390243036, -121.94016350000004
 |
| Object-Oriented Paradigm |
I can think of two ways to do this. One could go the
object-oriented route and use a 'has-a,' hierarchical relationship. Thus, a weavr has-a "bad" emotion, which, by the definition of an emotion, has-a "keyword" node. This node in turn has-an actual list of keywords that are associated to it. The result is a categorical structure that is grouped by object as per the
paradigm.
 |
| Distributed Paradigm |
Alternatively, one could link every association to the higher organization (i.e., "bad" to mystery_weavr and the list of keywords to "bad"), but without the intermediary category (e.g., emotion, keyword, etc.). Instead, all keywords could link to a global "keyword" node; all emotions could link to a global "emotion" node and so on and so forth. The result, using a similar formula to the history of philosophy graph, would be that the structural elements of the software (i.e., keywords, emotions, location_keywords, etc.) would have the most associations and thereby would be the largest in the visualization (Note: the pictures, as small datasets, do not show this visual structure). This simultaneously indicates the current software context and it provides a filtering mechanism through these categories. Thus, finding out the total number of emotions in the framework is easy: it is the number of edges from the "emotion" node. In sum, you can create a more distributed paradigm than the object-oriented version, which allows a user to utilize the key features of the coding structure without being bound to them (or forgetting them).

This basic idea should generalize to other weavr phenomena like blog posts and tweets. The combined frame of these features results in a very useful and very unique dataset visualization.
Pictures courtesy of:
http://drunks-and-lampposts.com/2012/06/13/graphing-the-history-of-philosophy/
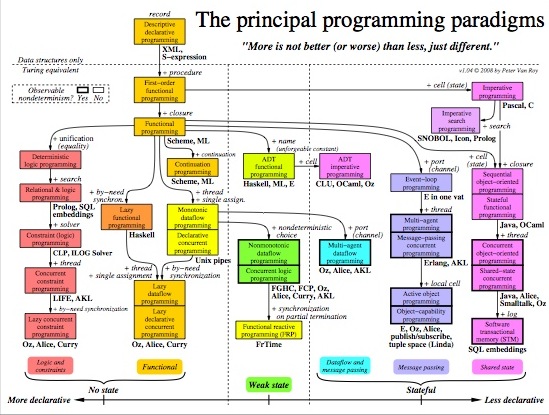
http://www.info.ucl.ac.be/~pvr/paradigms.html


No comments:
Post a Comment
A place in which to share your thoughts...